In this article, I want to introduce the Odin algorithmic trading and backtesting platform. I will exhibit how Odin can be leveraged to backtest a very simple buy-and-hold strategy for the Spyder ETF (SPY).
Design Philosophy
Odin was designed to be very modular so as to afford the user a large degree of control over the way that algorithmic trades are generated and processed. In this tutorial, several of these low-level modularities will be of immediate interest. The first of these is the FixedSymbolHandler class. For many algorithmic strategies, it is not reasonable or desirable to serve the entire universe of equities to the signal generator. The FixedSymbolHandler class in Odin controls which assets are provided with bar-level data and processed by strategies: In this particular example, we’ll focus only on trading SPY.
Another important class is the SuggestedProportionPositionHandler. Odin’s strategies do not generate an absolute number of shares to trade; instead, they generate a proportion of a portfolio’s total equity that should be allocated to a particular position. These suggestions can either be heeded or they can be disregarded at a later stage when orders are actually being submitted to the brokerage. In this particular example, we’ll allow the portfolio to simply follow the suggestions provided by the strategy. Indeed, since there is only a single asset in this strategy, the proportion of capital to allocate to that position will be unity. Glossing over some details, here is the code that constructs all of the necessary objects to use Odin to buy and hold the S&P 500 ETF.
# handlers.py

from odin.events import EventsQueue
from odin.handlers.portfolio_handler import PortfolioHandler
from odin.handlers.position_handler.templates import (
    SuggestedProportionPositionHandler
)
from odin.handlers.execution_handler import (
    SimulatedExecutionHandler
)
from odin.handlers.symbol_handler import FixedSymbolHandler
from odin.handlers.data_handler import DatabaseDataHandler
from odin.handlers.data_handler.price_handler import (
    DatabasePriceHandler
)
import settings


# Create a portfolio handler to manage transactions and keeping track of
# capital.
porth = PortfolioHandler(
    settings.maximum_capacity, settings.pid, settings.init_capital,
    settings.fid
)

# Events queue for handling market data, signals, orders, and fills.
events = EventsQueue()
# Symbol handler will determine which symbols will be processed during trading.
# In this example, we will just trade the S&P 500 ETF (SPY).
sh = FixedSymbolHandler(settings.symbols, [porth])

# Set up a price handler and a data handler to provide data to the trading
# system.
dh = DatabaseDataHandler(
    events,
    sh,
    settings.start_date,
    settings.end_date,
    settings.n_init
)
# Execution handler executes trades.
eh = SimulatedExecutionHandler(dh, settings.transaction_cost)

# Position handler to determine how much of an asset to purchase.
posh = SuggestedProportionPositionHandler(dh)
Backtesting & Configuration
Odin’s behavior is determined by the configuration parameters that are provided to it. For instance, one can infer (and correctly I might add) from the above code block that the DatabaseDataHandler serves bar and price data to the strategy for the time period between settings.start_date and settings.end_date. An important parameter of Odin’s configuration file is maximum_capacity, which appears in the PortfolioHandler object: This parameter determines the maximum number of combined pending and filled positions that a portfolio can hold. Assuming an equal partition of equity across all the holdings of the portfolio, each position will receive approximately 1.0 / maximum_capacity proportion of the equity.
Another important parameter is the assumed transaction cost of buying or selling an equity. In this example, we will only make a single trade: We will buy the SPY. This means that our transaction fees and commissions will be a non-issue compared to strategies that make large numbers of round-trip transactions. But in the interest of being comprehensive we will assume that buying an equity increases the cost by five-hundredths of a basis point.
Odin will display various kinds of information to the user depending on the requested verbosity level. For instance, a higher verbosity parameter (say, 3 for instance) will result in information about signal generation and order and fill events being printed to the console. On the other hand, a verbosity parameter of one will just display fill event data. The full set of configurations is given in the following code snippet.
# settings.py

import datetime as dt
import pandas as pd
from odin.utilities import params


# Start date and end date of the time series.
start_date = dt.datetime(2006, 1, 1)
end_date = dt.datetime(2016, 12, 30)
# Only trade the S&P 500 ETF.
symbols = ["SPY"]

# Start trading will $100,000 in capital initially.
init_capital = 100000.0
# Only hold a single position.
maximum_capacity = 1

# Number of prior trading days to download at the start of the time series.
n_init = 10
# Set an identifier for the portfolio.
pid = "long_buy_and_hold"
fid = "fund"
# Assume that transacting shares moves the price by five-hundredths of a basis
# point.
transaction_cost = 0.0005

# Set verbosity level.
verbosity = 1
Putting Odin Together
Putting together these components is simple in Odin. This is because all that is left to do is wrap all of the constituent components into a SimulatedFund object. Once this is complete, it will be trivial to backtest the strategy. Because a buy-and-hold strategy is fairly standard, it comes pre-implemented in Odin. Indeed, we need only the following code:
# fund.py

from odin.portfolio import SimulatedPortfolio
from odin.utilities import params
from odin.handlers.fund_handler import FundHandler
from odin.fund import SimulatedFund
from odin.strategy.templates import BuyAndHoldStrategy
import settings
import handlers


# Generate objects for the portfolios and strategies that the fund will trade.
portfolios = [
    SimulatedPortfolio(handlers.dh, handlers.posh, handlers.porth),
]
strategies = [
    BuyAndHoldStrategy(portfolios[0]),
]
# Create the fund and fund handler objects.
fh = FundHandler(
    handlers.events, strategies, settings.start_date, settings.fid
)
fund = SimulatedFund(
    handlers.dh,
    handlers.eh,
    fh,
    settings.verbosity
)
From here, we need only call fund.trade() to execute a backtest.
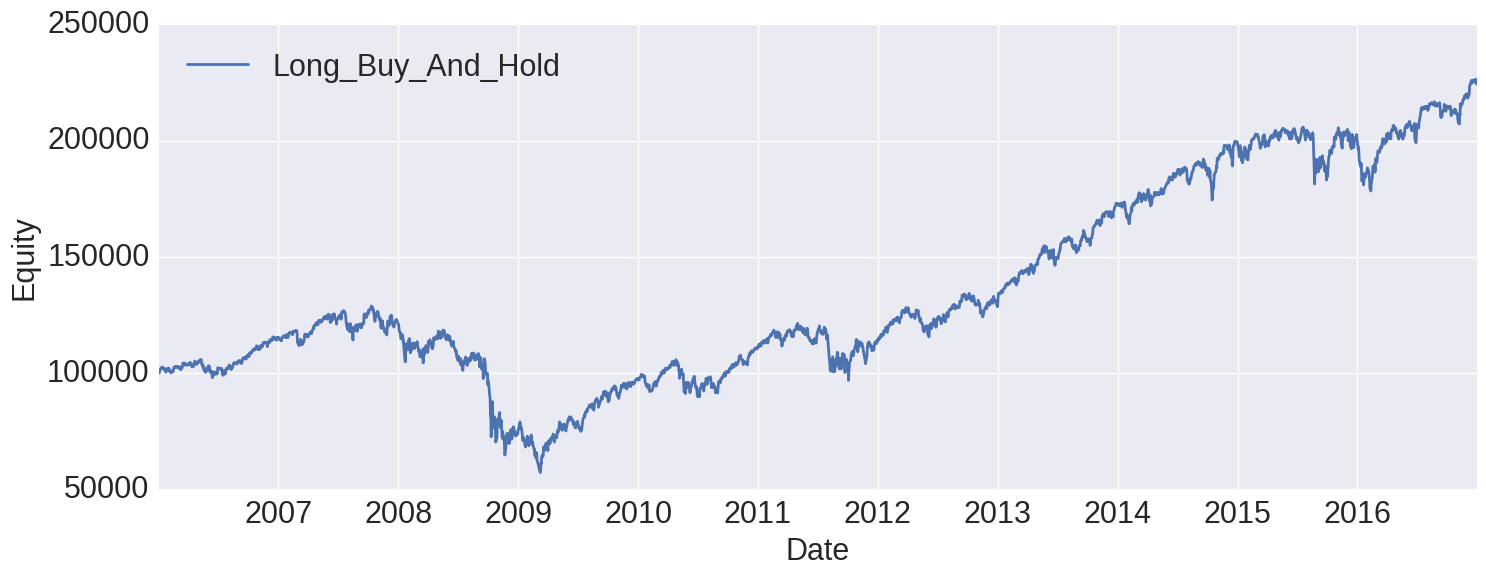
Results
The performance of the S&P 500 over this time period is well-known. In the past seven years we’ve seen a raging bull market in the wake of the 2008 financial crisis. Adjusting for dividends over the time period, we would have done slightly better than doubling our money off of an initial investment of $100,000.
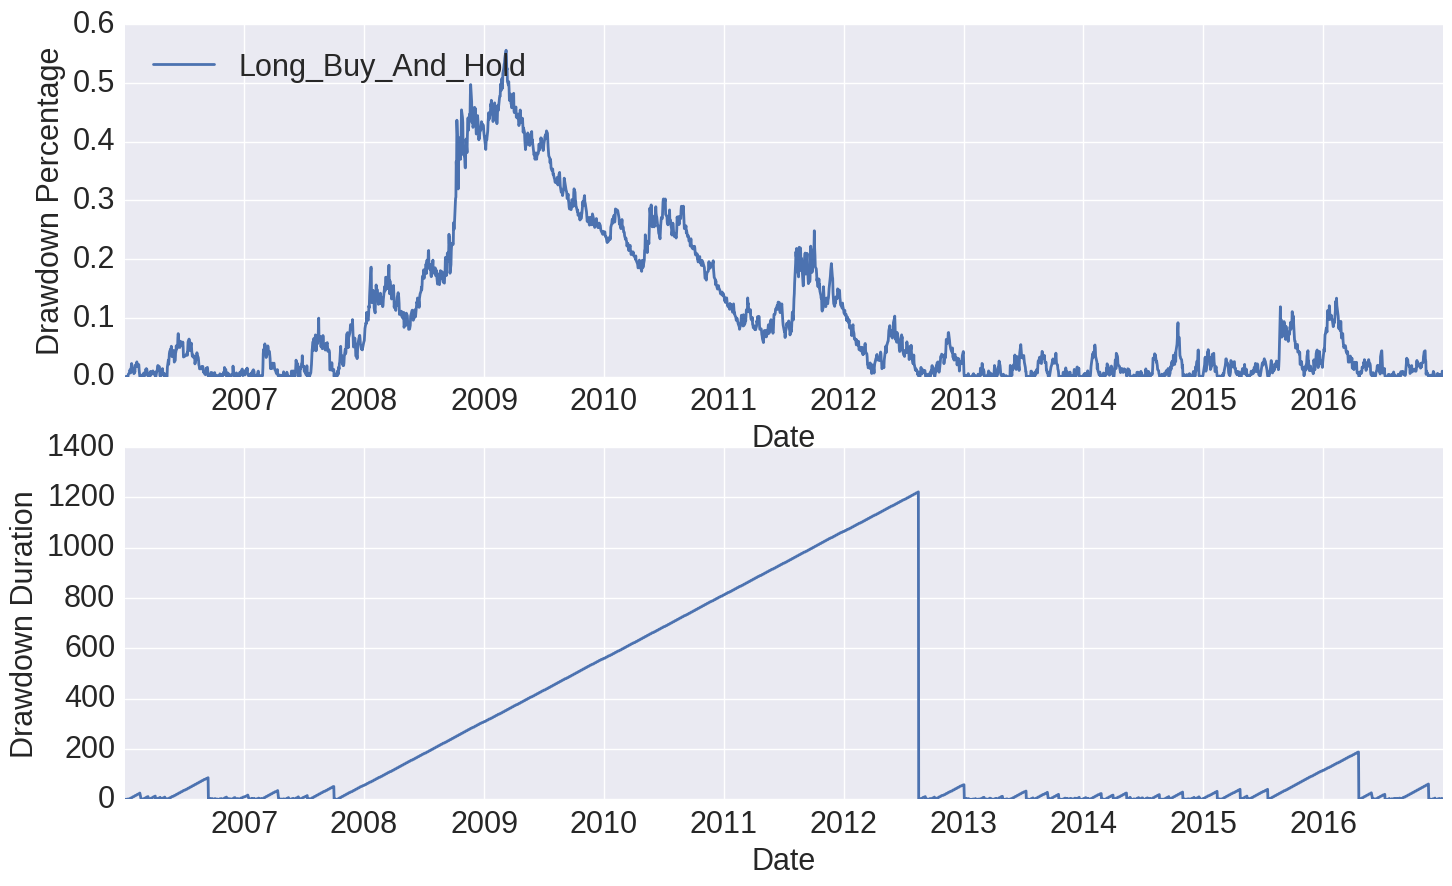
Studying the drawdowns, we see essentially the same story. Notice that it takes 1222 trading days for SPY to re-achieve its all-time high in 2007; that is nearly five trading years!
Future posts will exhibit other aspects and capabilities of Odin, including some more advanced trading strategies. In the meantime, I hope this post has been illustrative in demonstrating some of the core capabilities of Odin, namely that one can express a trading strategy and backtest it with historical data. Future articles will also show how to live trade strategies with Interactive Brokers and Odin.